Vernier LabQuest Streams are devices that allow you to collect data using an anemometer, barometer, and other probes. Select the device below that your students will be using to collect data for experiments for detailed directions.
iPad Directions
1. Download the Vernier Graphical Analysis GW app from Self Service.
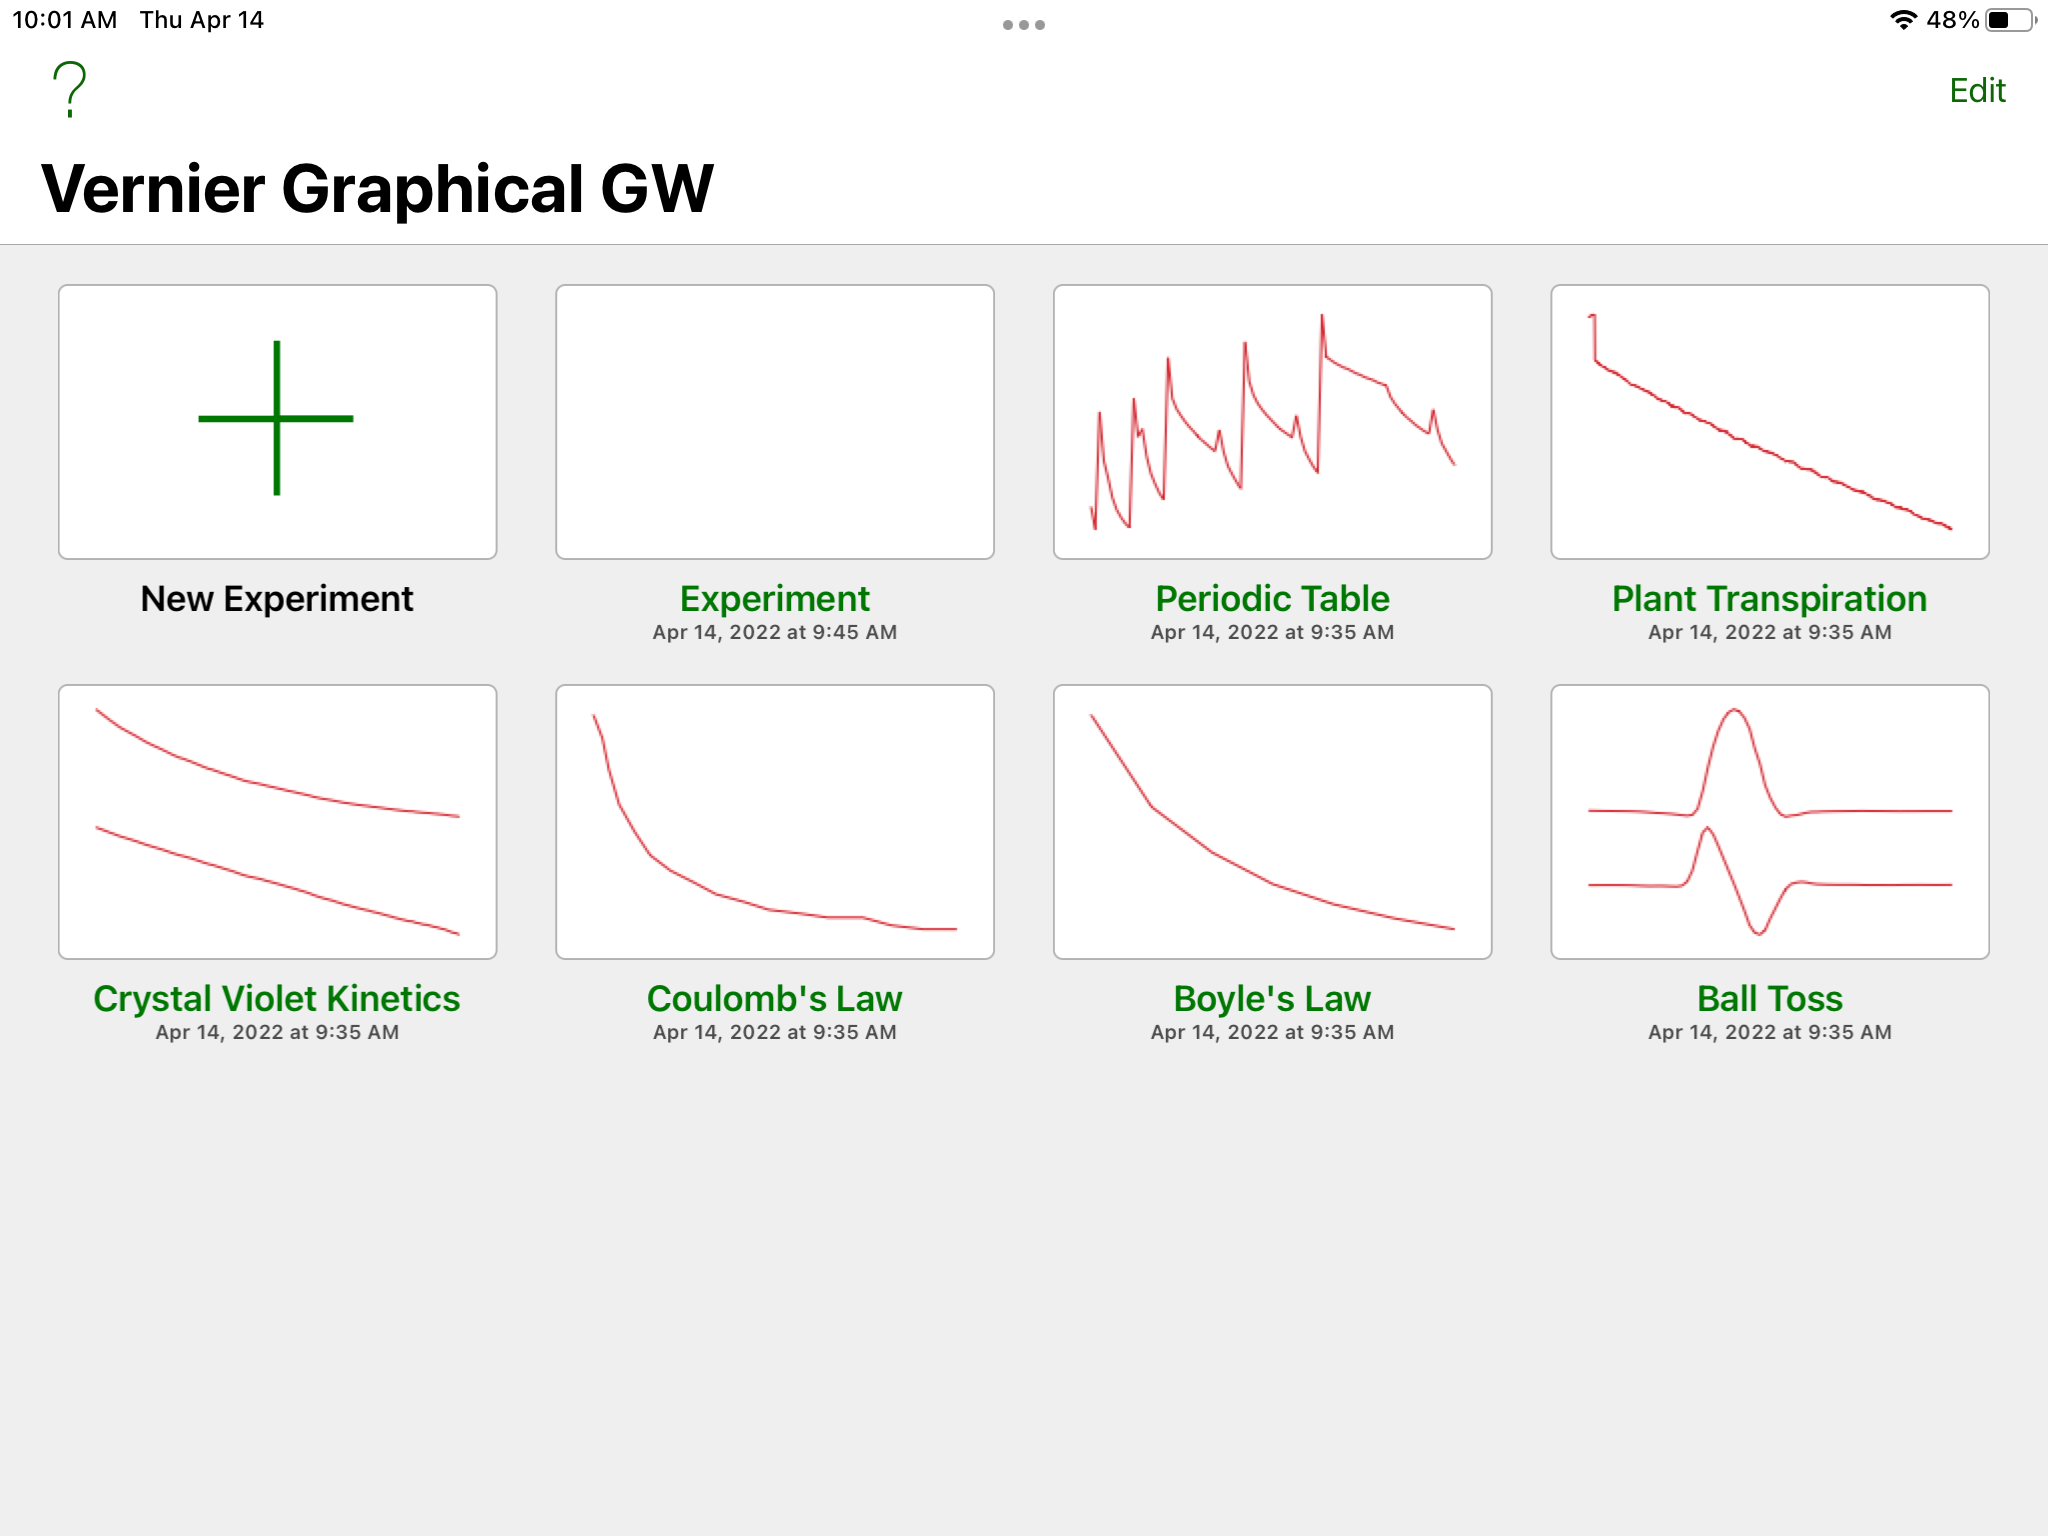
2. Open the app and tap on the + to create a new experiment.
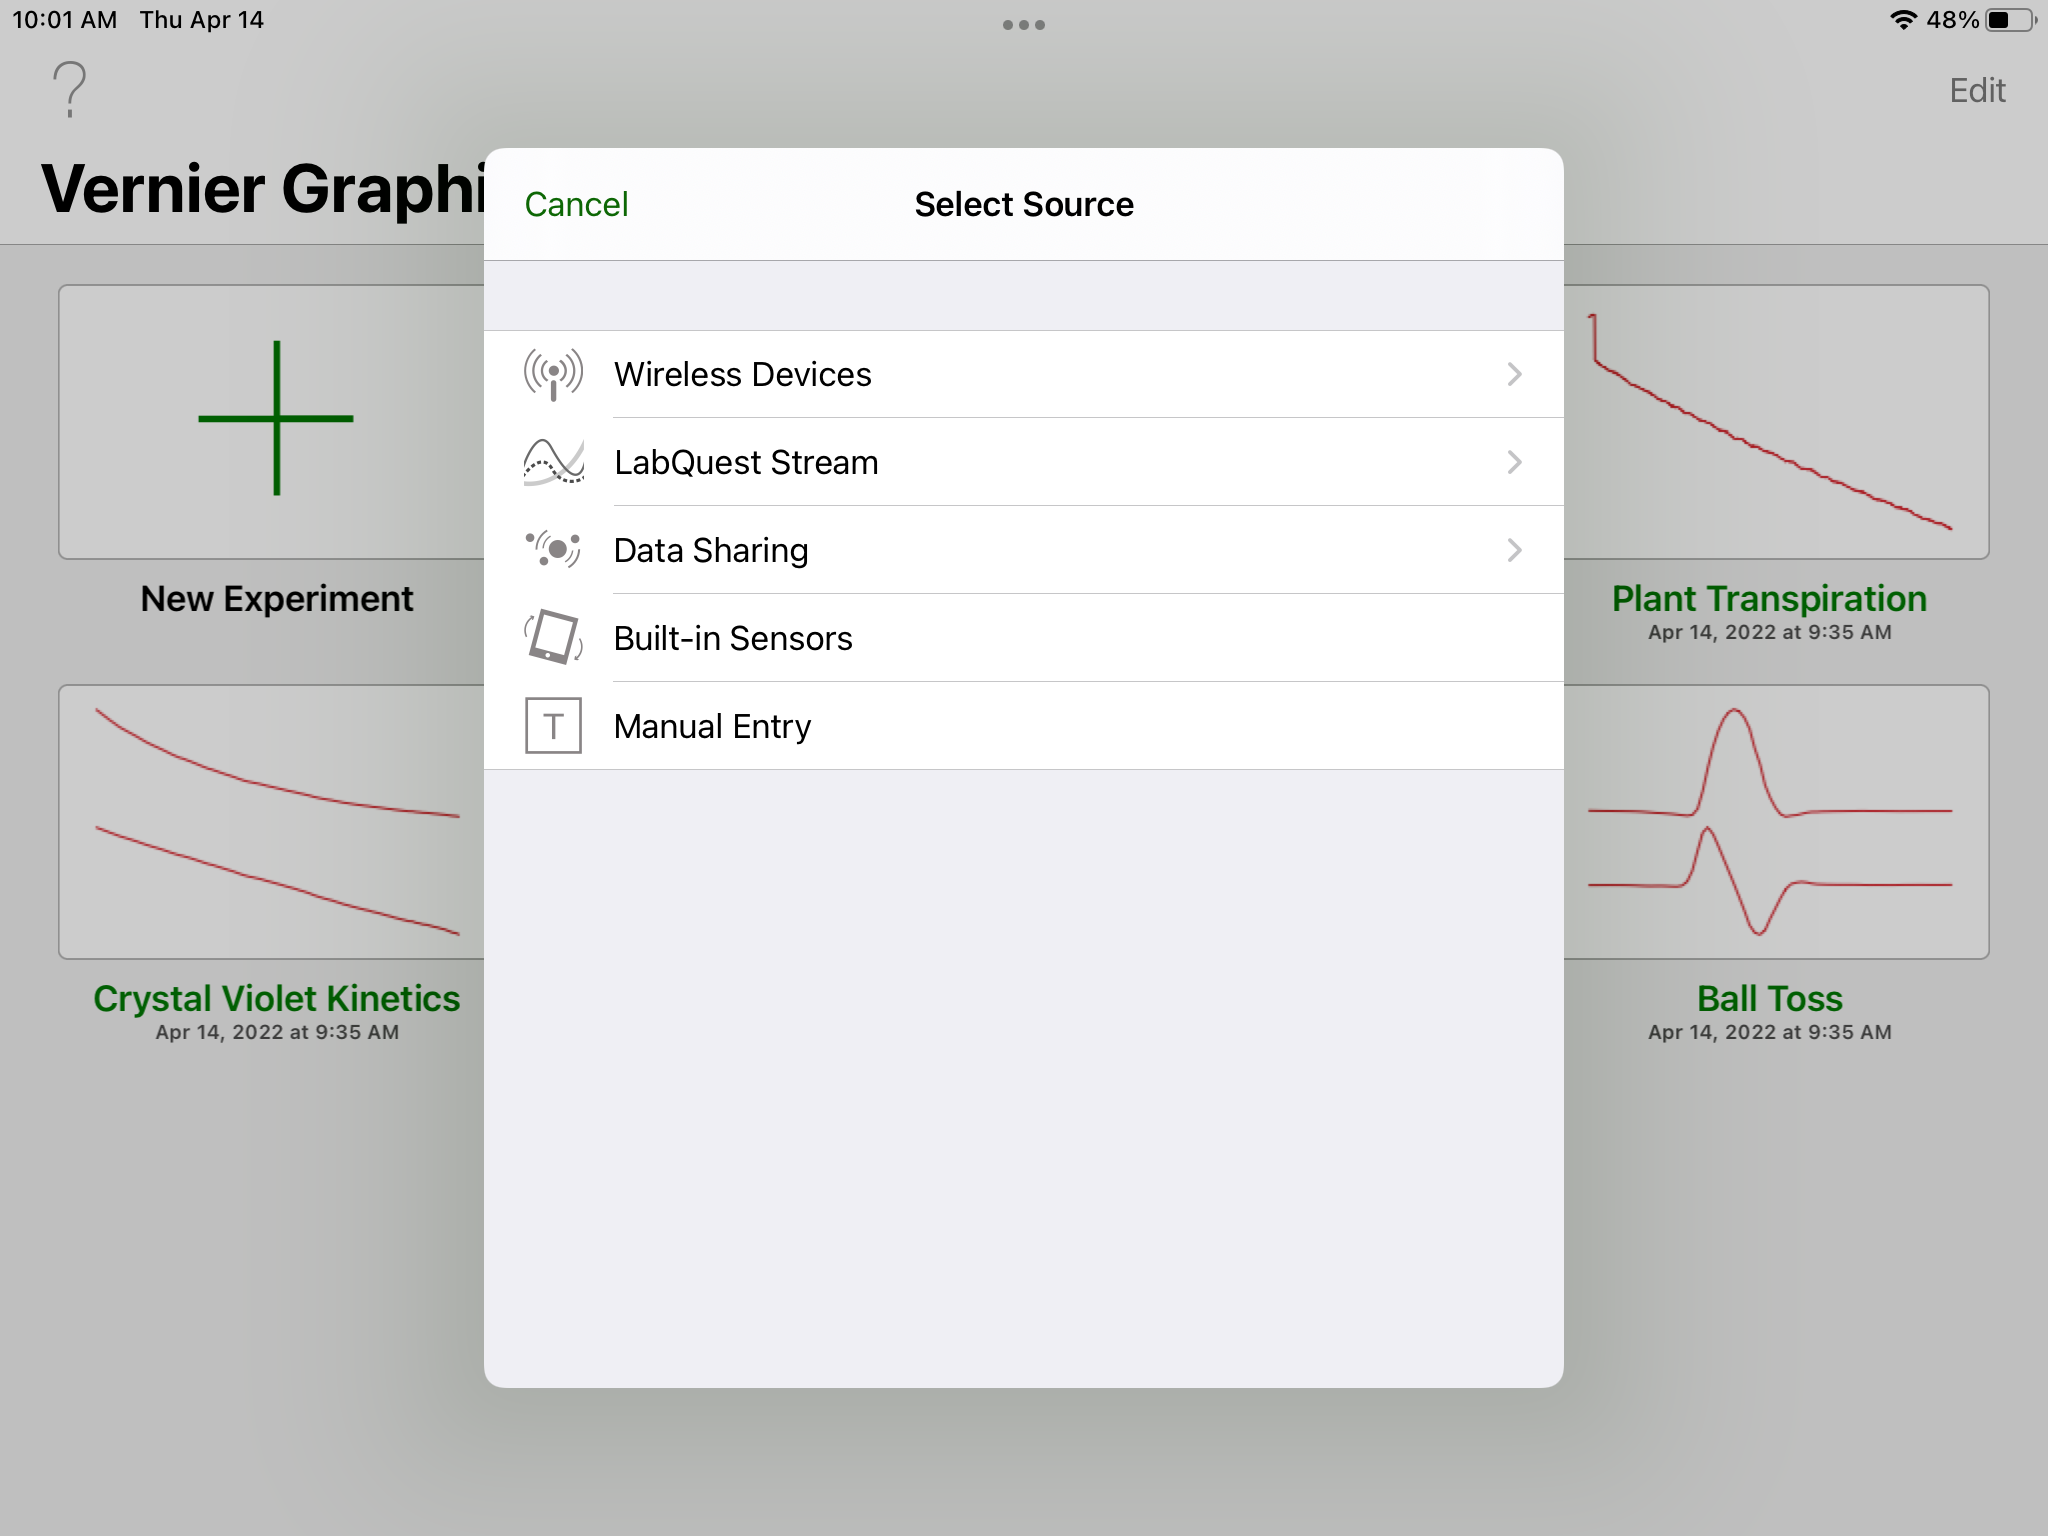
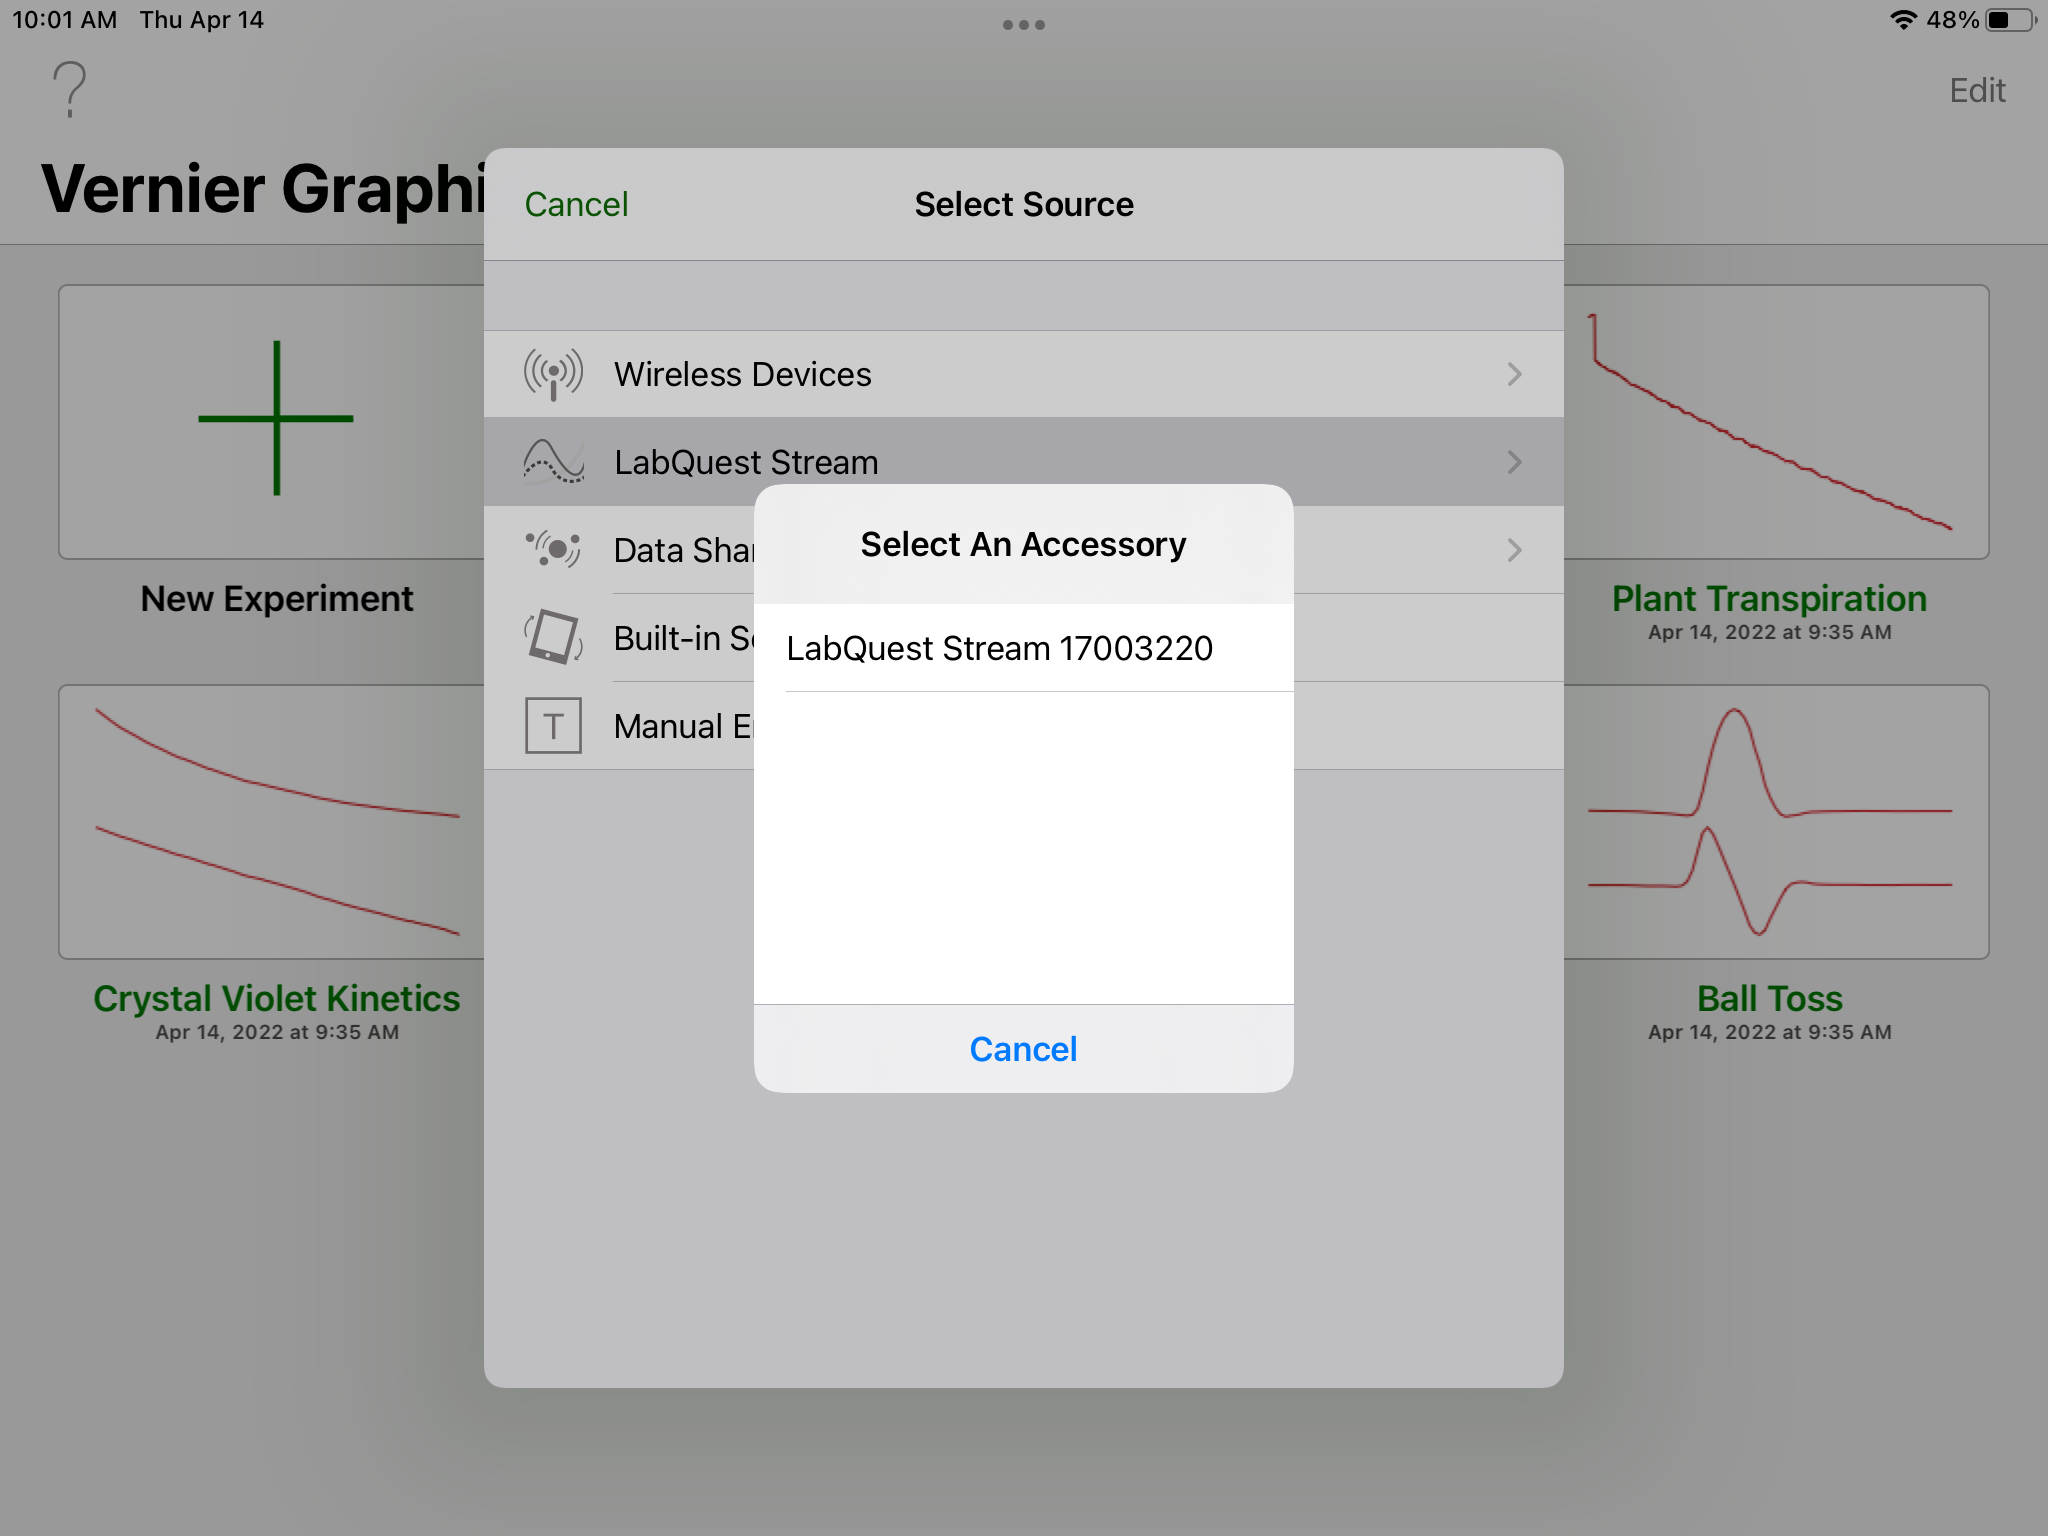
3. Select the device you are using; the LabQuest Stream.
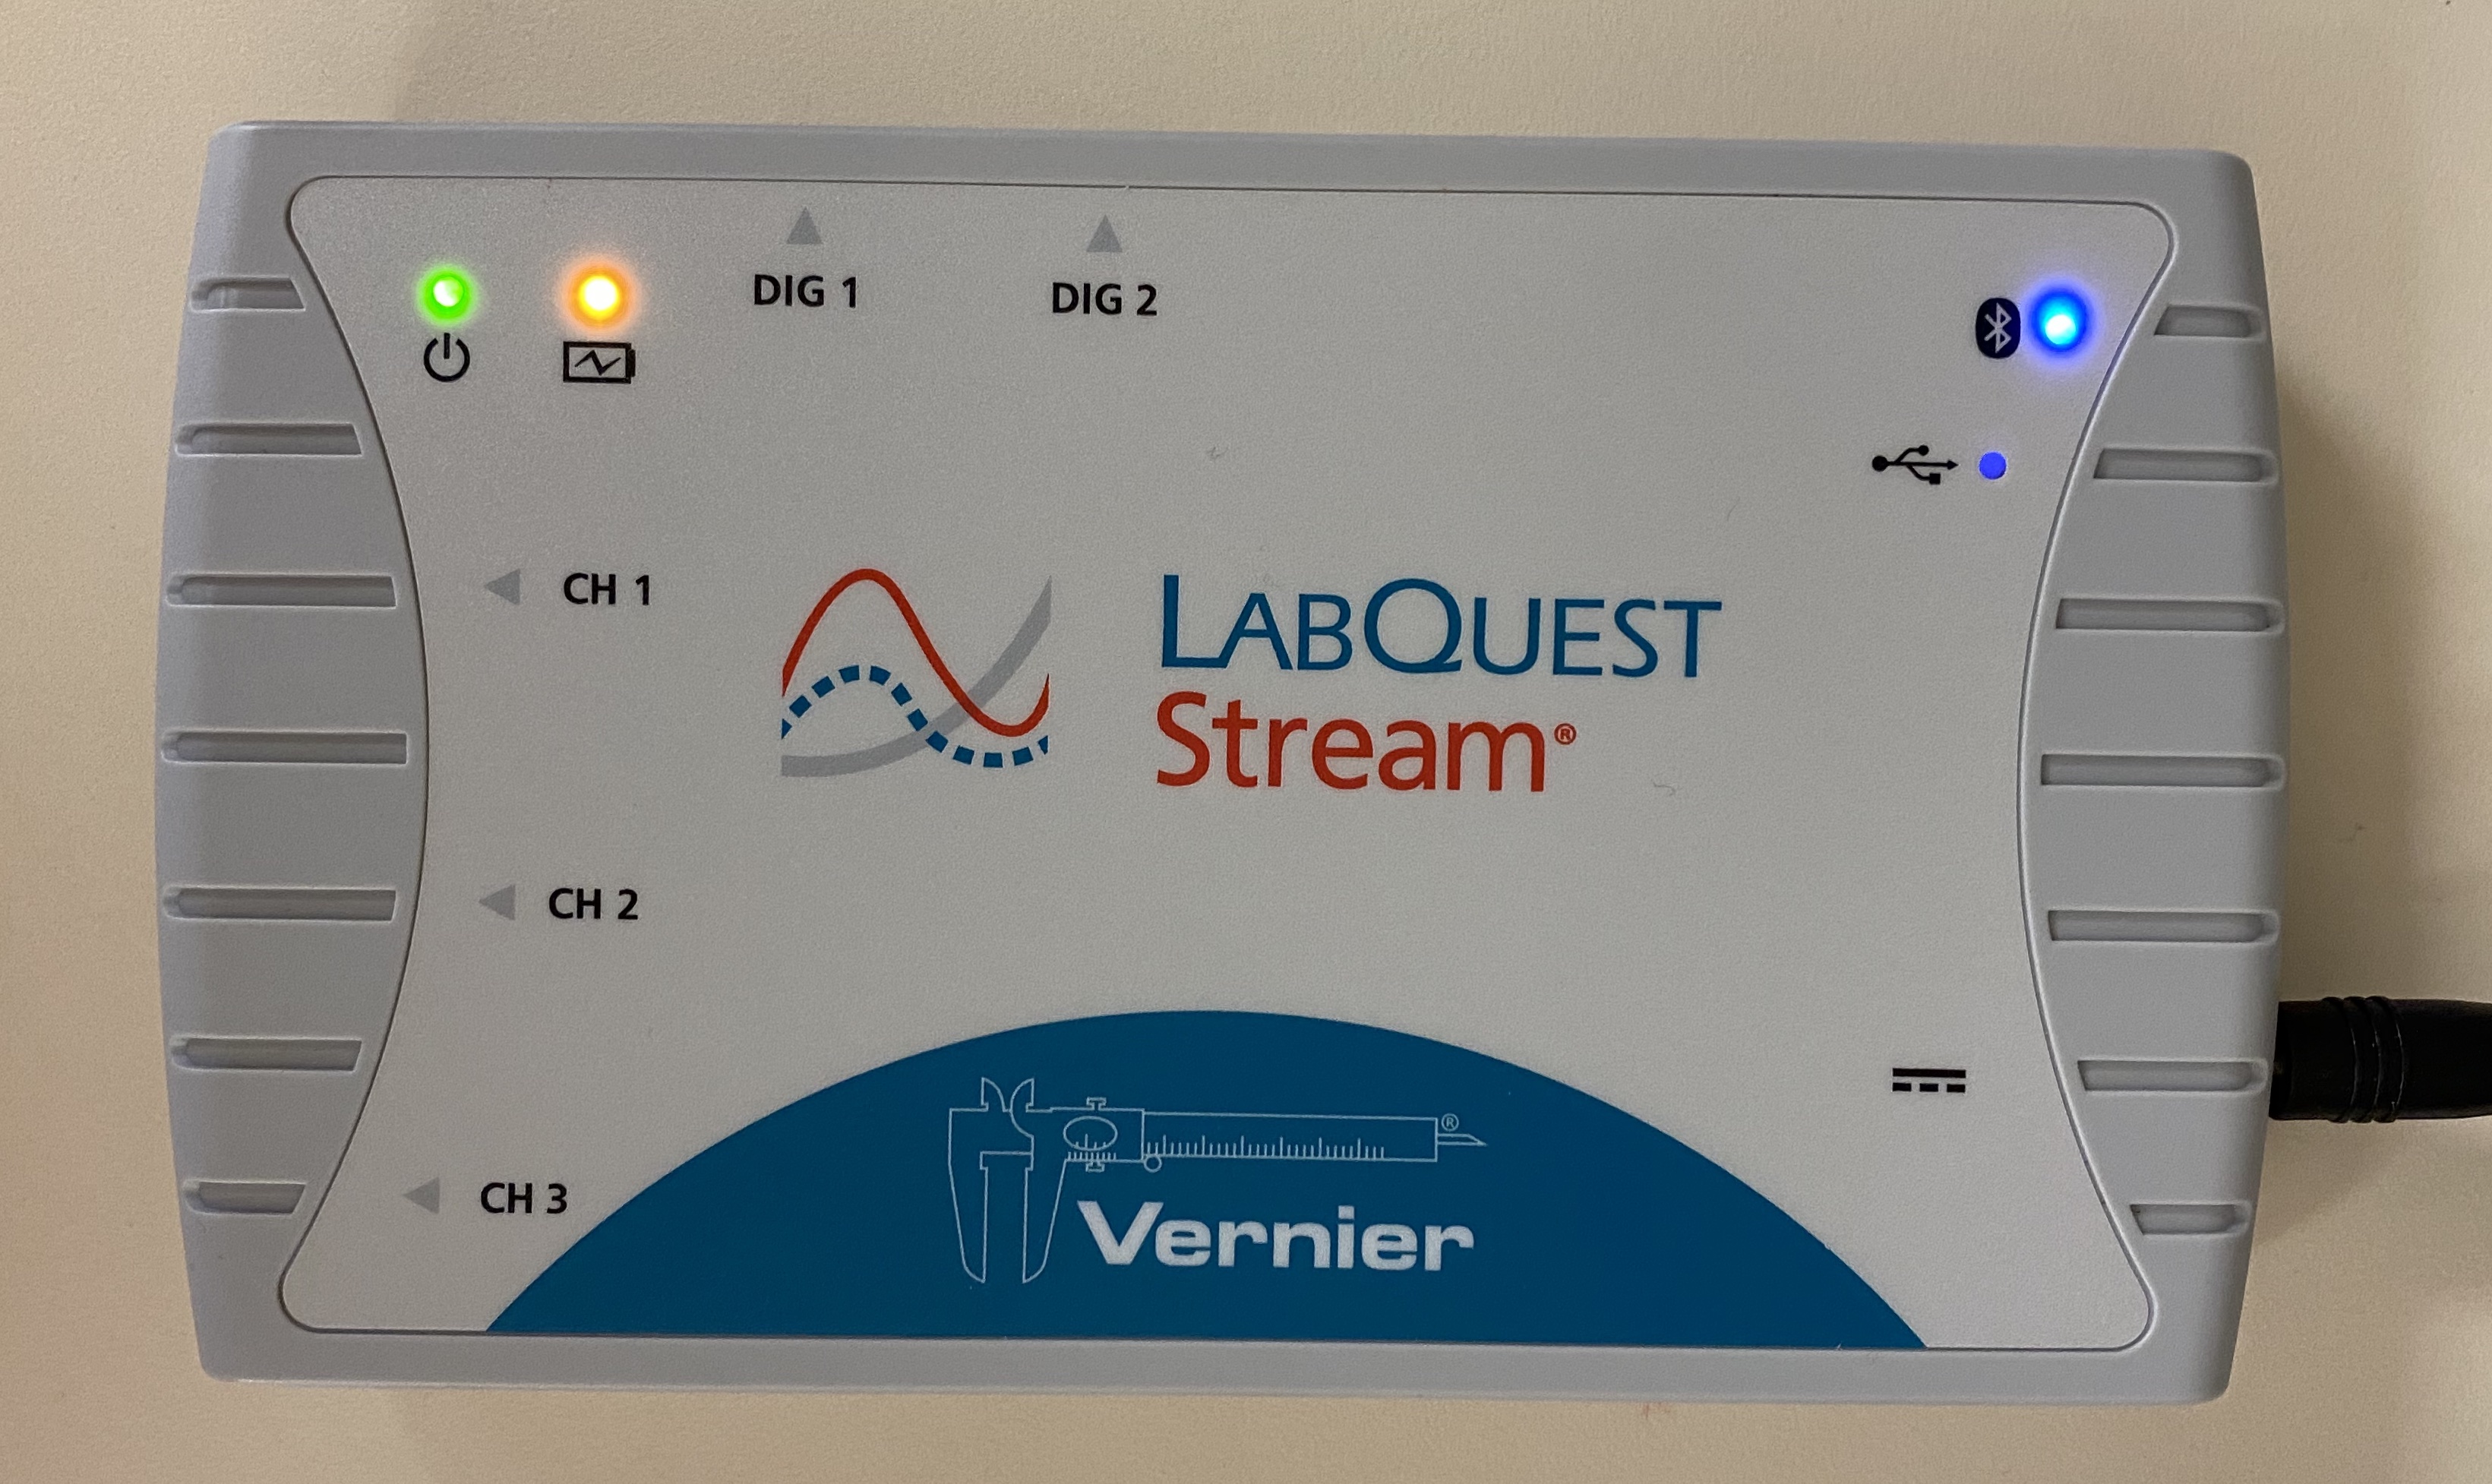
4. Power on the LabQuest. It will have a blue blinking light. It should then pop up a screen that looks like this that allows you to connect to the LabQuest via Bluetooth.
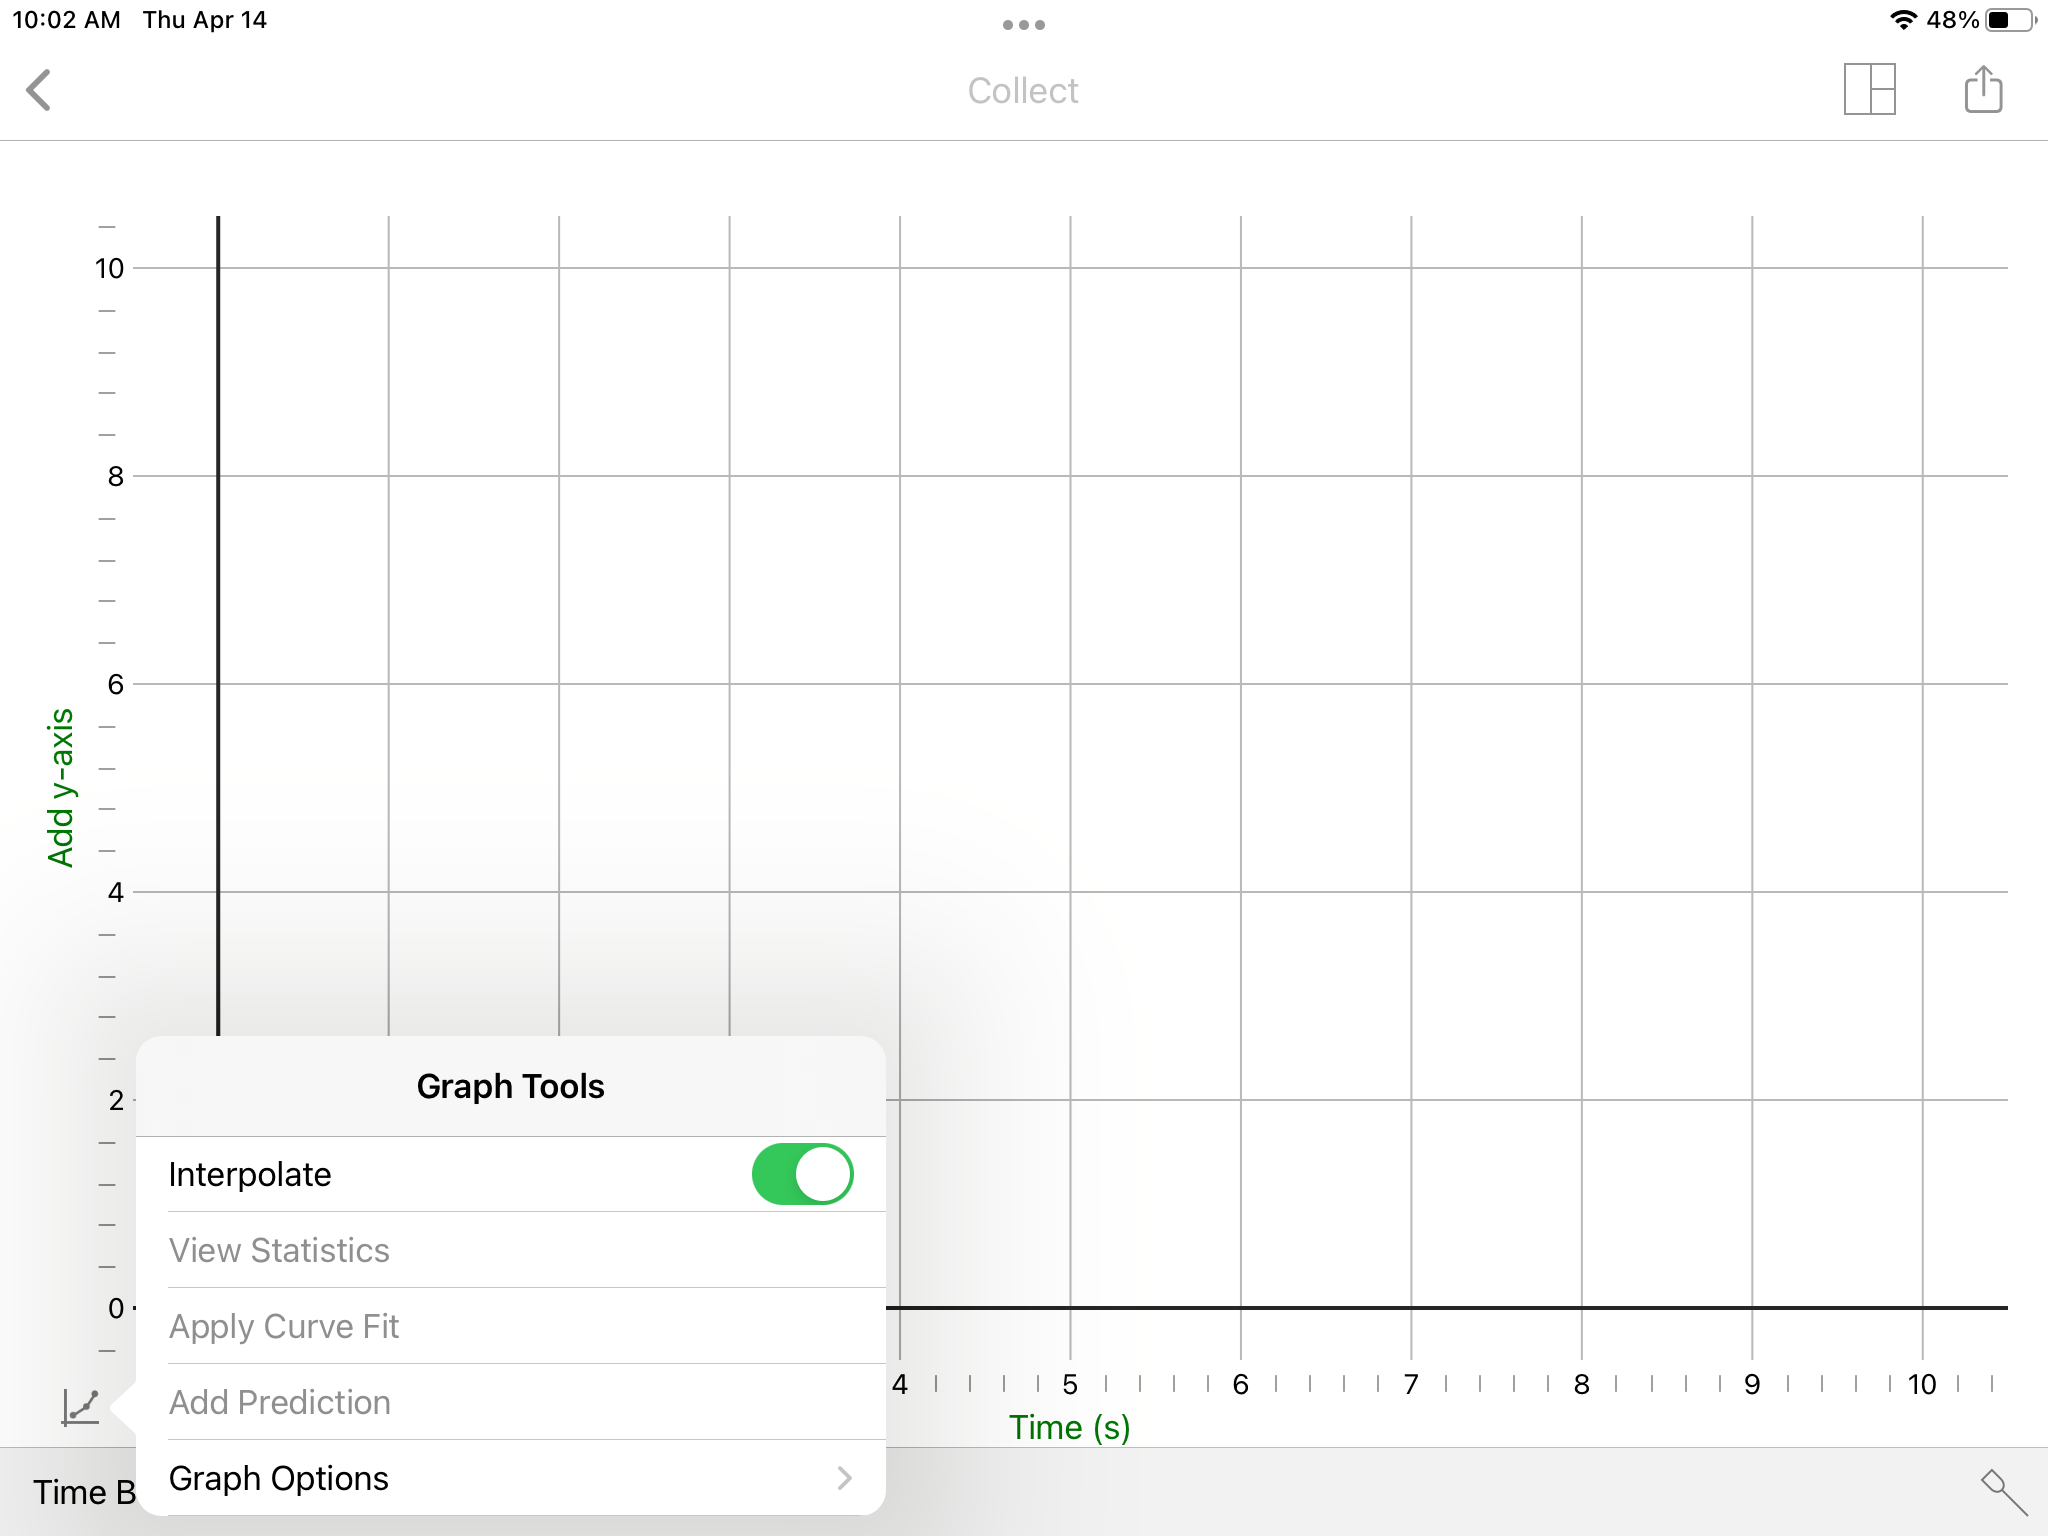
5. Before you start, tap on the Graph button in the lower left corner. Flip on the switch for Interpolate so that your data will be graphed as it is collected. You can also tap on Graph Options to change the scale of the each axis on the graph.
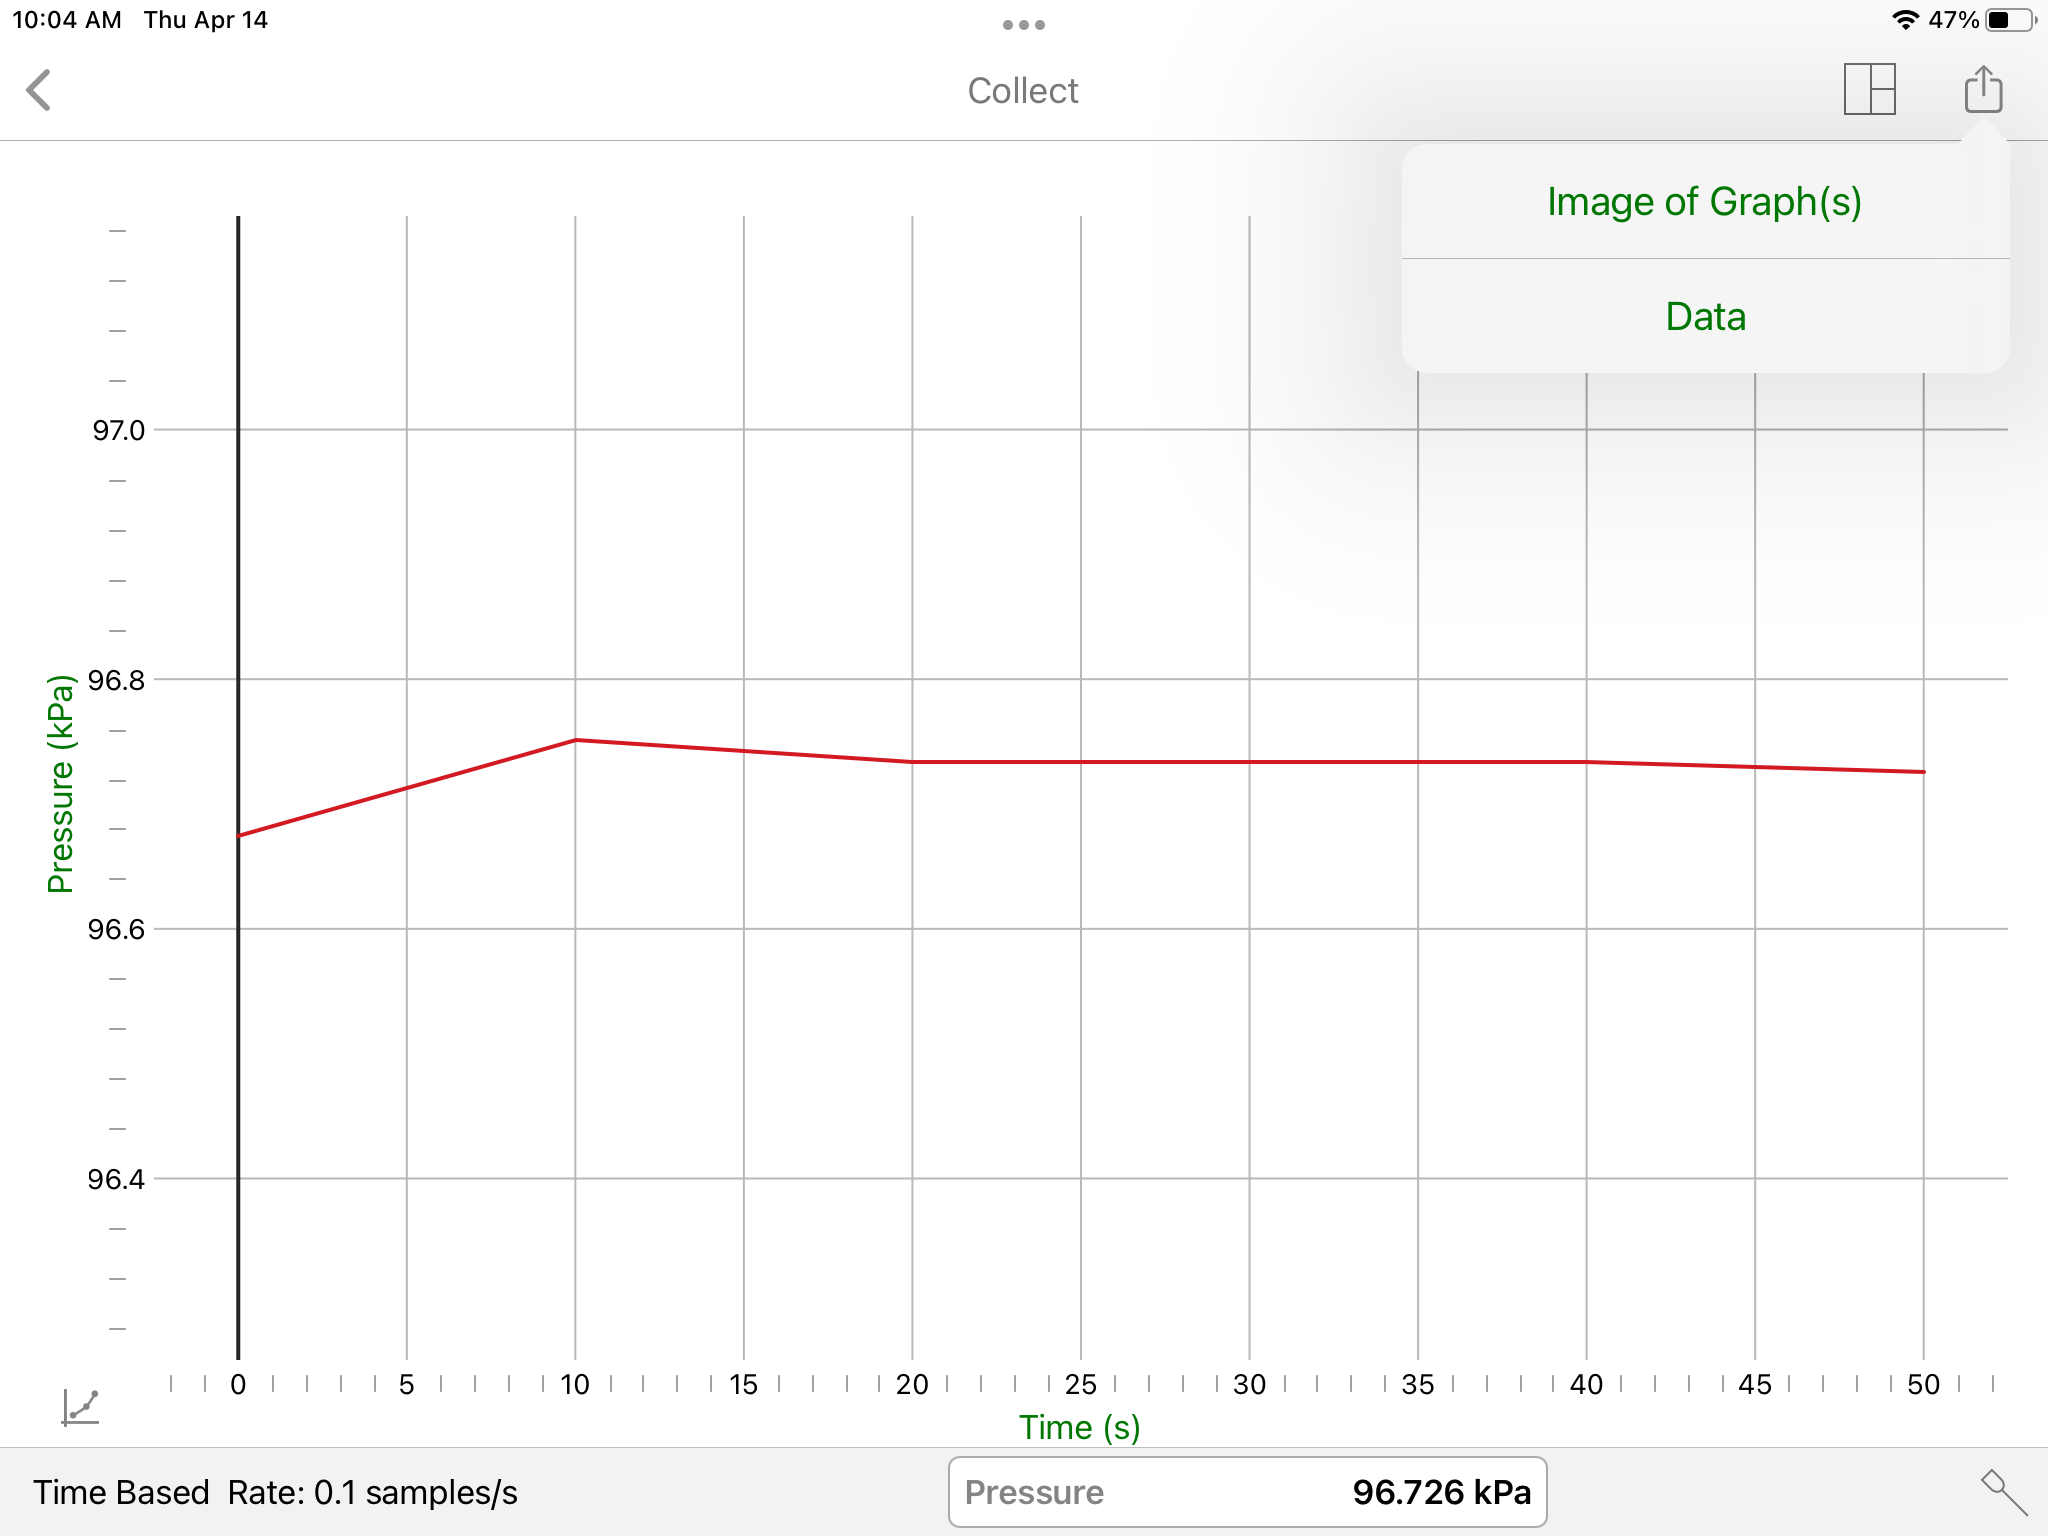
6. Tap Collect on the top of your screen when you are ready to get started. Tap on Stop when you are done collecting.
7. Once you have your data, you can tap the share button and either export an image to your camera roll or another app or you can export the data. It is recommended that you use Google Drive (and then Sheets app) or the Numbers app to open the data as the data is exported as a CSV spreadsheet.
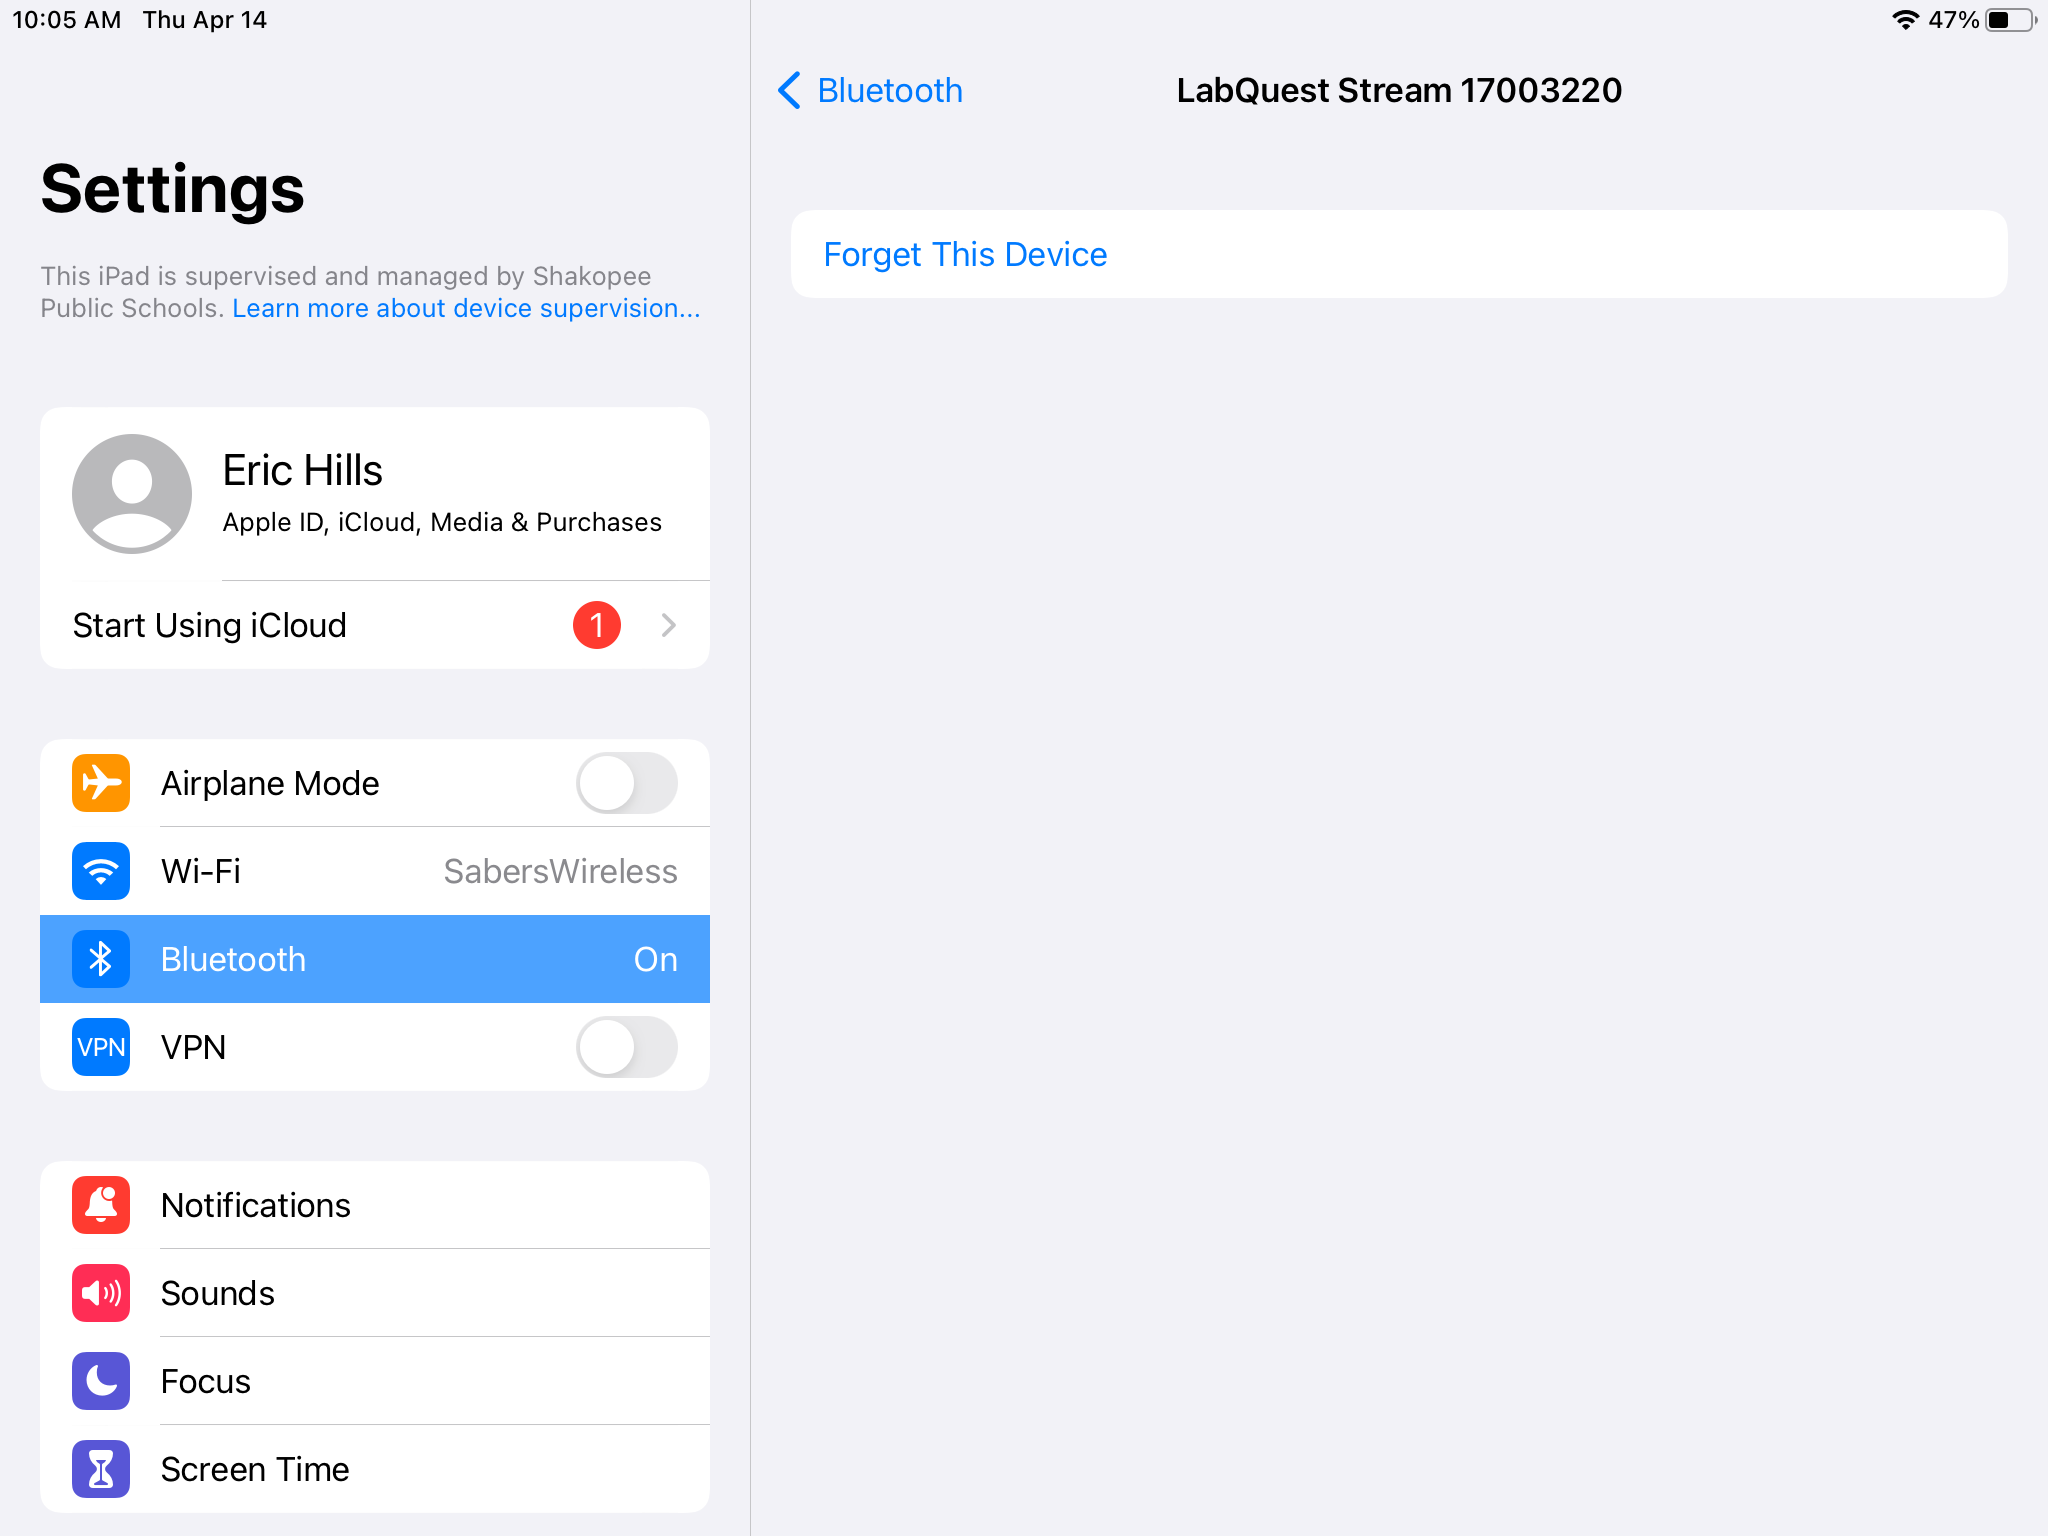
8. When you are done using the LabQuest, open the Settings app, tap on Bluetooth, tap the i icon, and "forget this device."
MacBook Directions
1. Install Logger Pro 3 from Self Service.
2. Open Logger Pro and allow it to use Bluetooth if you are prompted.
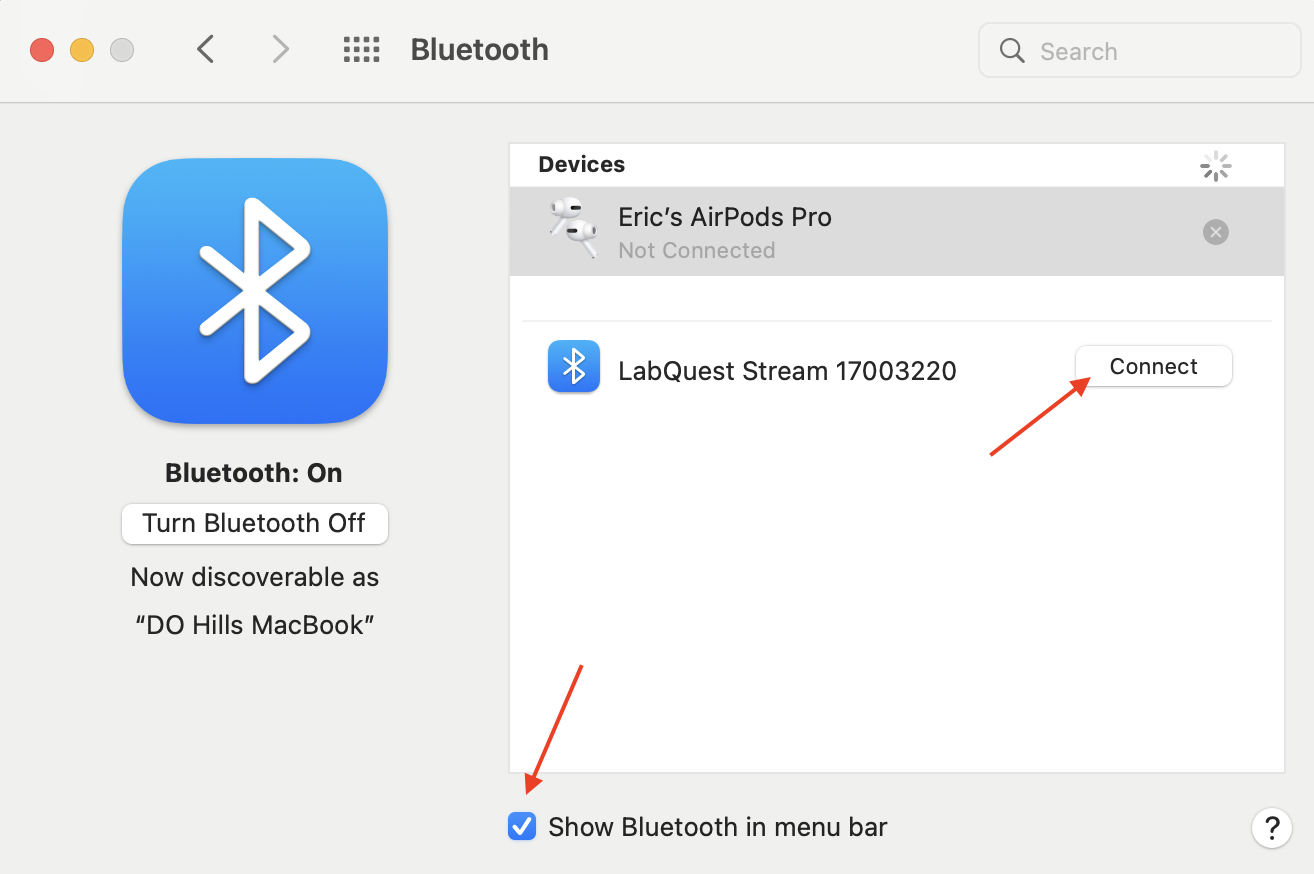
3. Open Bluetooth in System Preferences and connect to the LabQuest Stream. Also check the box so Bluetooth settings appear in your menu bar on the top of your screen going forward.